The World’s First Development of Ultrahigh Speed Neuronal Activity Imaging Technology
- Objective and Quantitative Evaluation of Mental Disorder or Cognitive Damage in Degenerative Brain Disease
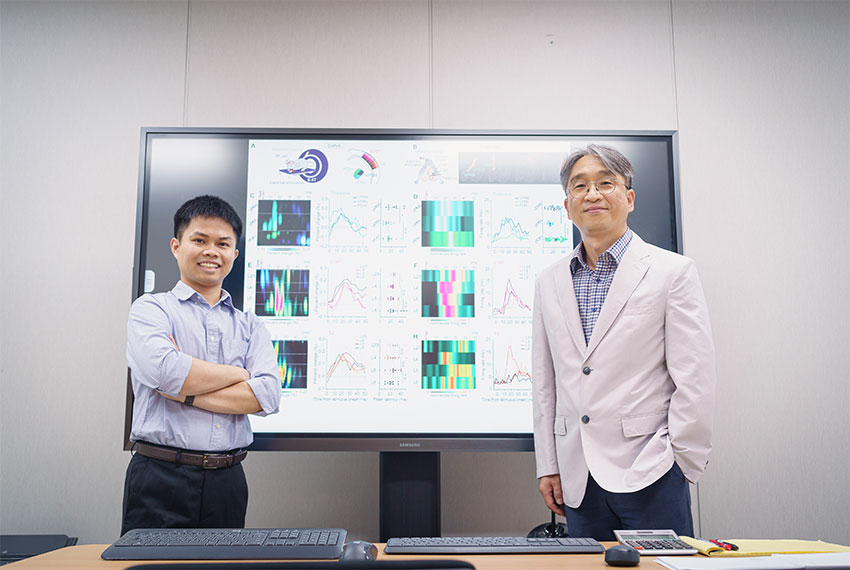
Prof. Jangyeon Park’s research team (Department of Biomedical Engineering) has developed the world’s first future-generation brain function imaging technology which can visualize neuronal activities in ultrahigh resolution with millisecond precision.
The major verification of suggested high-speed neuronal activity imaging technology was conducted in cooperation with Prof. Jeehyun Kwag’s (Korea University) electrophysiology research team.
Advanced noninvasive neuroimaging methods provide valuable information on the brain’s functional organization. However, the most widely used noninvasive neuroimaging methods such as functional Magnetic Resonance Imaging (fMRI), Electro Encephalo Graphy (EEG), and Magneto Encephalo Graphy (MEG) have clear merits and demerits in terms of temporal/spatial resolution which reacts as an important limitation in investigating brain in vivo. For example, EEG and MEG provide excellent temporal resolution (~millisecond), but spatial information is limited (~centimeter). On the other hand, fMRI using the blood oxygenation level-dependent (BOLD) effect provides high spatial resolution (~millimeters) but its temporal resolution is limited (~second) and can only provide indirect neural activity information based on hemodynamic responses.
Prof. Park’s research team expected that if magnetic resonance imaging (MRI) with milliseconds temporal resolution close to nerve action potential difference time is demonstrated, direct imaging and measurement of neuronal activity can be rendered possible. Thus, they presented milliseconds of high temporal resolution MRI by using the method of splitting the imaging data. The research team used this method to implement direct imaging of neuronal activities in high temporal & spatial resolution at the same time as imaging the process of neural activities being transported in neural networks. Also, they suggested an important hypothesis related to the new signaling pathway of direct neural activity images.
The research team demonstrated the ultrahigh-speed neuronal activity imaging technology through animal MRI in the vivo mouse brain at 9.4 teslas. Electrical stimulation was applied periodically to the whisker pad of anesthetized mice to obtain time-series neural activity imaging of 0.22 mm spatial resolution and 5 milliseconds temporal resolution, including the thalamus and primary somatosensory cortex (S1) and confirmed neural activity reactions at 20-25 milliseconds. Moreover, they also confirmed neural reaction at the thalamus between 10-15 milliseconds before neural activity reaction at S1, and through this, they visualized how neurotransmission occurs over time on the thalamic-cortical neurotransmission pathway through the thalamus to S1. Also, with this new signaling pathway of ultrahigh-speed neural activity imaging, the team suggested Changes in T2 relaxation time according to changes in cell membrane displacement during neural actions.
The high temporal/spatial resolution in vivo brain neural activity imaging technology suggested by the research team is the future generation brain function imaging technology that can show how neural activity signals are transmitted in brain neural networks along with direct imaging of neural activity by visualizing neural activities in vivo brain with milliseconds resolution. Through this future-generation brain function imaging technique, an almost real dynamic brain neural network model that can reflect and represent how brain functions are being performed in various cognitive processes can be demonstrated. In clinical aspects, by making the objective and quantitative evaluation of cognitive impairment or mental illness in degenerative brain disease possible, it contributes to the current trend of modern medical science, individually customized precision diagnosis.
Prof. Park said, “This study is very meaningful in that it implements neural activity images in vivo with high temporal and spatial resolution, which has been a long-cherished desire in the field of brain function imaging. In particular, the ability to image the activation and transmission of neural activity in a brain neural network with ultrahigh temporal resolution means that the brain neural network can visualize the flow of information, or the flow of thought, according to the cognitive process. Through this, we can achieve a deep, practical understanding of the ‘thinking brain’ by identifying the hierarchical connection structure of brain function. If it is verified to be applicable to humans as well, this will be the ‘Game Changer’ in the brain sciences field.”
The research results have been published in the international journal ‘Science’ (IF: 47.728) as a Research Article and have also been posted in the commentary article ‘Perspectives’ which comments on noteworthy research papers. Along with the publication of the thesis, Nature news also covered an article about the thesis and the same for The Scientist (UK) and STAT News (USA).
※ Paper Title: “In vivo direct imaging of neuronal activity at high temporo-spatial resolution”
※ Science, https://www.science.org/doi/10.1126/science.abh4340
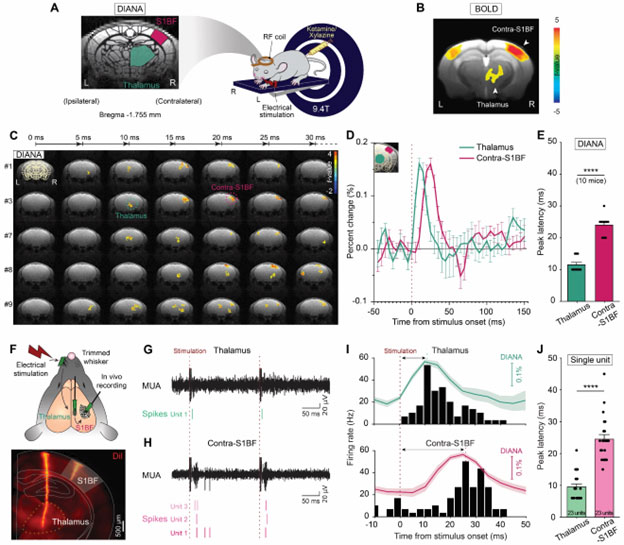
[Figure 1] High temporospatial resolution DIANA captures thalamocortical spike propagation
(A) Illustration of the DIANA experiment to image the contralateral S1BF and thalamus by applying electrical stimulation to the left whisker pad in an anesthetized mouse on a 9.4-T scanner (right) and brain imaging of a coronal slice containing both thalamus and S1BF regions (left). (B) BOLD activation map obtained as a reference (n = 10 mice). (C to E) Time series of t-value maps of DIANA for 30ms after electrical whisker-pad stimulation in 5-ms temporal resolution from five mice (C), percent changes in DIANA signals (D), and a bar graph showing the mean latencies of peak DIANA responses from the thalamus (green) and contralateral S1BF (magenta) (E) (n = 10 mice, ****p < 0.0001 for paired Student’s t-test). (F) Illustration of electrophysiological recording in mice in vivo with silicon probes implanted in the thalamus and contralateral S1BF applying electrical whisker-pad stimulation (top) and electrode track marking using a fluorescent lipophilic dye (DiI) (bottom). (G and H) MUA (black trace, top) from which single-unit spikes (bottom) were analyzed in the thalamus (green) (G) and the contralateral S1BF (magenta) (H).
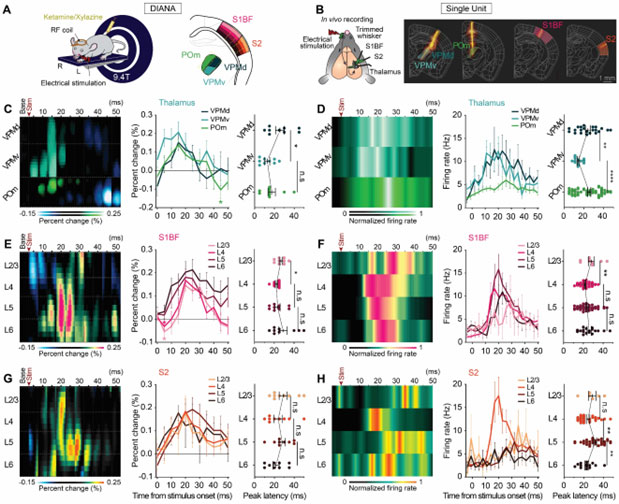
[Figure 2] Sublayer-specific DIANA responses reveal functionally distinct sublayer-specific microcircuits
(A and B) Illustration of the DIANA experiment (A) and in vivo spike recording (B) in the VPMd, VPMv, POm, S1BF, and S2 in response to electrical whisker-pad stimulation. Yellow dotted boxes in [(A), right] indicate extraction areas of DIANA heatmaps. (C) Heatmap (left) and temporal profile (middle) for the percent change in the DIANA signal, displayed with the mean latency of peak DIANA response from the VPMd (dark green), VPMv (green), and POm (light green) (right) (n = 9 mice). (D) Heatmap of in vivo–recorded single-unit spike firing rate normalized to the peak spike firing rate (left) and temporal profile of spike firing rate (middle), displayed with the mean latency of peak spike firing rate in the VPMd (dark green, n = 22 units from 16 mice), VPMv (green, n = 15 units from 16 mice), and POm (light green, n = 59 units from 14 mice) (right). (E and F) Same as (C) and (D) but for DIANA experiments (n = 9 mice) and spikes recorded from S1BF in L2/3 (light pink, n = 9 units from 28 mice), L4 (pink, n = 51 units from 28 mice), L5 (magenta, n = 60 units from 28 mice), and L6 (dark magenta, n = 18 units from 28 mice). (G and H) Same as (C) and (D) but for DIANA experiments (n = 9 mice) and spikes recorded from S2 in L2/3 (light orange, n = 6 units from 20 mice), L4 (orange, n = 27 units from 20 mice), L5 (brown, n = 35 units from 20 mice), and L6 (dark brown, n = 14 units from 20 mice). The base in DIANA heatmaps indicates the average of prestimulation frames. The asterisk in the middle panels of (C) and (E) indicates the statistically significant negative signal. All data are means ± SEM. *p < 0.05, **p < 0.01, ****p < 0.0001, and n.s. is p > 0.05 for paired Student’s t test, unpaired Student’s t-test, and Welch’s t-test.